Shandong Normal University Smart Campus
Participating School: Shandong Normal University
Advisors: Chang Yong, Xu Wenpeng
Team Members: Zhang Yingchao, Zhang Xiaoying, Yang Qingli, Chen Qiuyu
Group Photo (from left): Zhang Yingchao, Chen Qiuyu
ⅠProject Introduction
System Background
With the expansion of university campuses and facility construction, the number of surface features on campus continues to increase, leading to complex spatial distribution relationships. Traditional printed maps, which are updated slowly, can no longer meet the needs of administrators, teachers, students, and visitors for campus information. Therefore, establishing a Smart Campus GIS platform to integrate campus surface features and related information into a management system, providing users with convenient query and analysis functions, will help locate key buildings and facilities and enhance the level of digital and information technology development. The team created a comprehensive smart campus management system integrating spatial scene visualization, query, analysis, management, and emergency handling based on the SuperMap ecosystem.
Data Production and Processing
Geographic data was obtained through team collection and downloading open-source data online. The main acquisition methods are as follows:
System Module Design and Technical Approach
The system overall uses a B/S architecture, divided into browser-based applications and mobile applications. SuperMap iServer is used for GIS service publishing. The web frontend primarily uses the VUE3 framework, while the server-side uses the Spring framework. SuperMap iClient JavaScript for Cesium is used for scene optimization. Both SuperMap iClient JavaScript for Cesium and SuperMap iClient JavaScript for Leaflet are used for GIS spatial analysis operations.
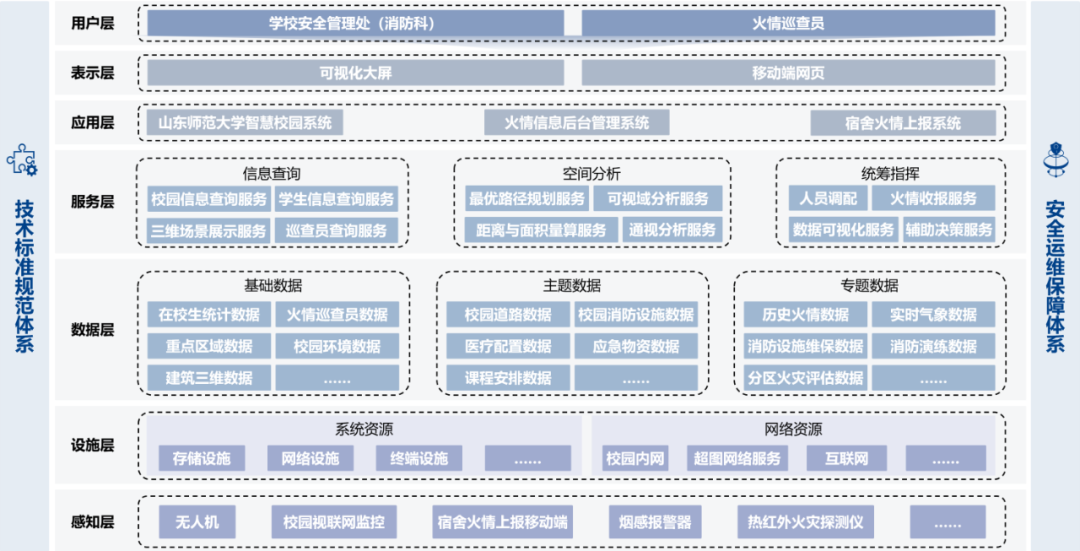
Figure 1 Module Design Diagram
System Function Demonstration
1. User Interface (Campus)
This interface displays seven categories of basic information about the Changqing Lake Campus of Shandong Normal University: University Overview, Academic Programs, Research Papers, Financial Budgets (Last Six Years), Research Projects, Logistics Support, and Campus News.
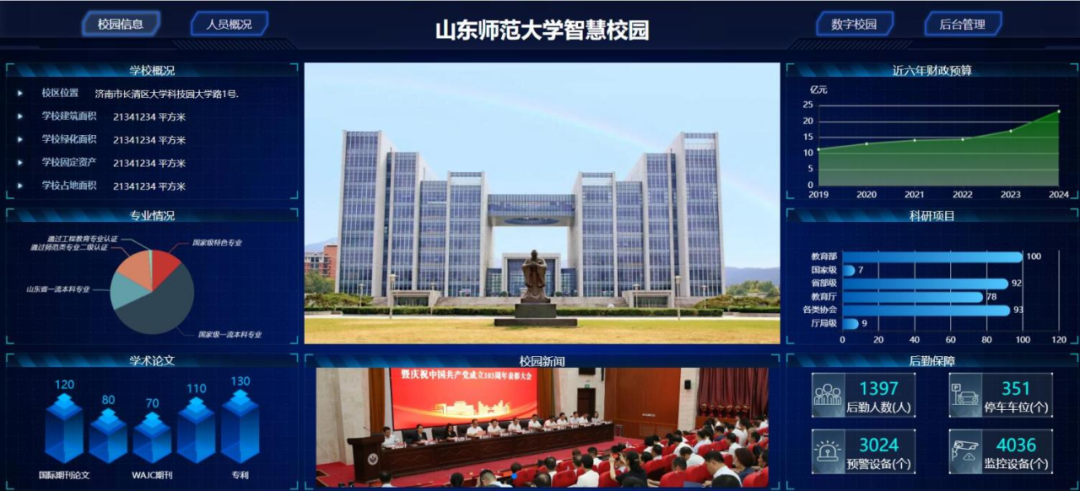
Figure 2 Campus Information
This interface displays six categories of basic information about the Changqing Lake Campus: Student Categories, Graduate Destinations (2024), Recommended Postgraduate Students, Admissions Statistics (Last Six Years), Faculty Sources, and International Exchange.
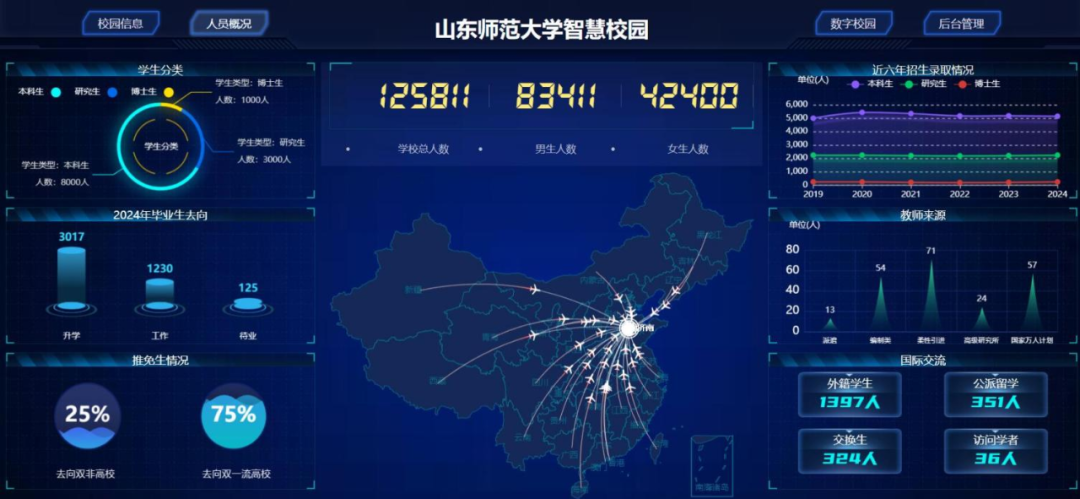
Figure 3 Personnel Overview
The Weather Simulation function allows switching between different weather conditions to view the campus.

Figure 4 Digital Campus - Weather Simulation
Basic functions include Roaming, Campus Zoning, and Scene Snapshot. After clicking the "Roaming" button, the system can browse the campus scene along a specified flight path. Clicking the Campus Zoning button displays the distribution of various functional areas on campus. Clicking the Scene Snapshot button allows exporting an image of the area of interest currently on the screen.
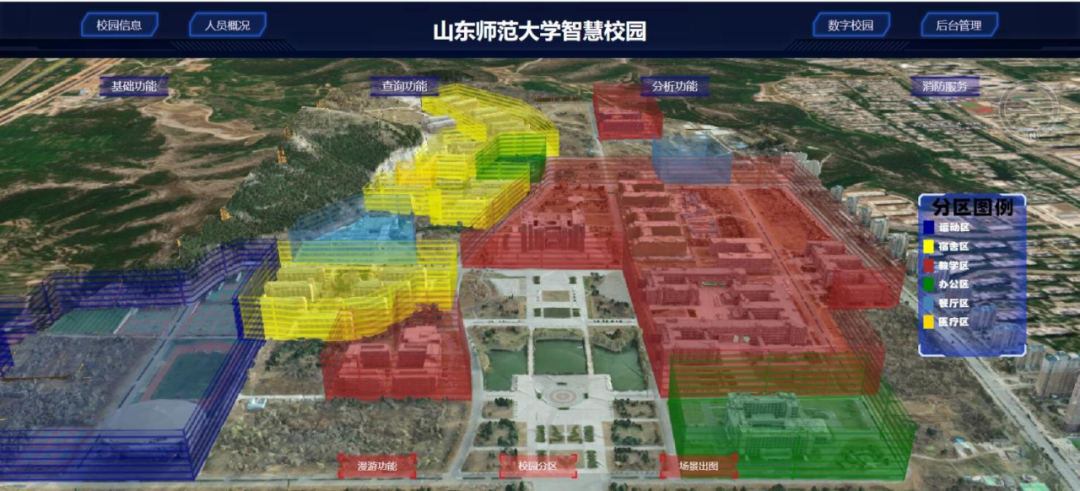
Figure 5 Basic Functions
Users can determine the start point, waypoints, and end point by clicking to add model points or by entering text, to query the optimal path. The query results are rendered onto the campus 3D model.
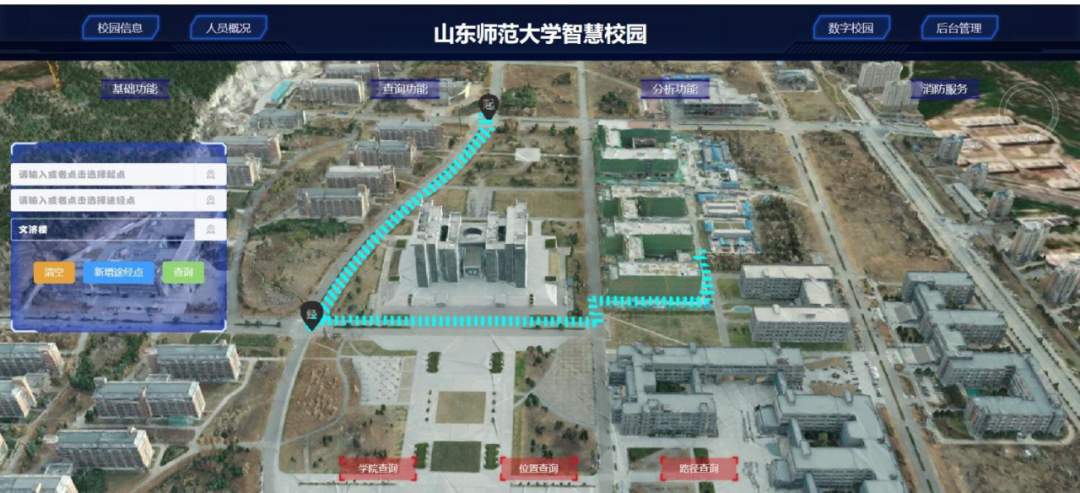
Figure 6 Query Function - Path Query
Analysis functions include Measurement Analysis, Line-of-Sight Analysis, and Viewshed Analysis, totaling three types.
The Measurement function includes Distance Measurement and Area Measurement. It can measure the distance between two points or the area of a region on the model. Users can add observer points and target points by clicking to analyze visible and non-visible areas. Users add an observer point by clicking and adjust the viewshed range by modifying four parameters: Horizontal View Angle, Vertical View Angle, Pitch Angle, and View Distance.
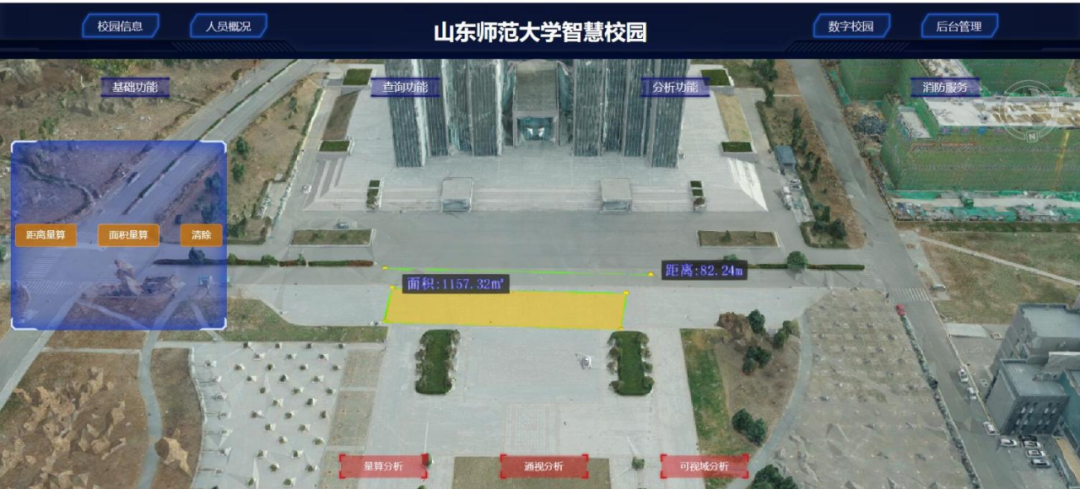
Figure 7 Analysis Functions
The Fire Alarm function can receive information reported from the mobile terminal about disasters and assign tasks to personnel.
.png)
Figure 8 Fire Alarm Function
2. User Interface (Dormitory Buildings)
The user interface can query student information, dormitory building floor-by-floor information, dormitory room information, and implement function services such as bounding box clipping.

Figure 9 User Interface Functions
3. Mobile Terminal Disaster Reporting Interface
Includes functions such as Fire Reporting, Task Viewing, Campus Navigation, and Personnel Information Viewing.
System Highlights
Ⅱ Team Summary
During the development of the Smart Campus Comprehensive Management System, team members fully utilized their respective professional strengths and collaborated closely. The Data Collection Group accurately acquired diverse data such as campus oblique photography and BIM models, providing a solid foundation for system operation; the Technical Development Group meticulously built the B/S architecture, combined with frameworks like VUE3 and SpringBoot, efficiently completing system function development; the Testing and Optimization Group rigorously ensured system stability and efficient operation.
Through this project, team members gained rich experience in GIS technology application, software development processes, and solved challenges such as data integration and system performance optimization, enhancing the team's overall strength.
In the future, the team will continue to learn new technologies, optimize system functions, improve data security, and strive to create a smarter, more efficient, and secure campus management system, contributing more to campus digitalization.
Ⅲ Advisor's Review
The project presented by this team is based on SuperMap's product solutions. The system design is reasonable and features highlights such as a user-friendly interface, multi-terminal collaboration, in-depth application of GIS technology, and intuitive visual presentation, fully demonstrating the team's solid accumulation and innovative capabilities in the field of Geographic Information Systems.
The project content covers the entire process from data acquisition and processing to system development, while also applying various cutting-edge and hot technologies, such as UAV oblique photography, BIM modeling, and 3D scene construction, reflecting strong technical integration capabilities. The system design balances aesthetics and practicality, with rich functionality, particularly outstanding in spatial analysis and emergency handling, providing strong technical support for campus management and related fields.
During the project, team members had clear divisions of labor, collaborated closely, and achieved remarkable results. It is hoped that the next step will involve continuing in-depth research, integrating technologies such as IoT and AI, to further optimize system performance.
© 1997-2025 SuperMap Software Co., Ltd.
6/F, Building 107, No. A10, Jiuxianqiao North Road, Chaoyang District, Beijing
Links:SuperMap